Keeping the CPU temperature in check is vital to your Windows computer’s health and performance. A hot CPU can result in throttling and unpredictable BSOD crashes. It can further impact the CPU clock speeds by melting down slowly, therefore, reducing its lifespan. To prevent this, learn how to check CPU temperature in Windows using the following methods.
Also helpful: if you’re on a Mac, learn how to enable turbo boost.
Content
- How to Check PC Temperature in BIOS/UEFI
- Other Ways to Check CPU Temperature in Windows
- 1. ThrottleStop
- 2. HWMonitor
- 3. Core Temp
- 4. Speccy
- 5. HWinFO
- 6. Open Hardware Monitor
- 7. Ryzen Master (AMD Ryzen CPUs only)
- Monitoring Your CPU Temperature When Gaming
- What’s an Ideal CPU Temperature?
How to Check PC Temperature in BIOS/UEFI
Your PC manufacturer may have its own CPU thermometer tool built into the UEFI/BIOS. To access it, restart your Windows computer, then quickly press a specific key that leads to the UEFI/BIOS screen. Depending on your laptop brand, it’s either F2, F6, F12, Esc, or Del.
Once inside the BIOS screen, you can check the CPU temperature inside one of the available BIOS sections. The section labels can be very different: H/W Monitor, PC Health or Status. Some BIOS screens may not have any CPU temperature monitors at all.
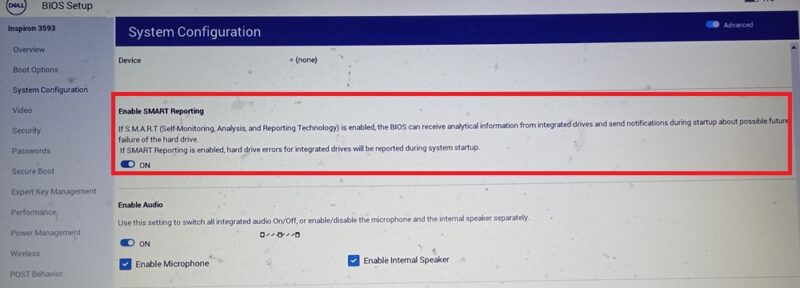
In that case, consider enabling S.M.A.R.T (Self-Monitoring Analysis and Reporting Technology) Reporting. This BIOS feature administers tests on the hard drive and reports any overheating due to excessive temperatures.
Tip: still stuck with legacy BIOS? Learn how to quickly convert it to UEFI in just a few simple steps.
Other Ways to Check CPU Temperature in Windows
Checking the PC temperature using UEFI/BIOS is not very convenient when the device is under use.
Whether or not your BIOS supports temperature monitoring, there are many other apps that can help you check the CPU temperature in Windows. Most of them will also tell you the hard disk/SSD temperature, the GPU temperature, and the ambient temperature as well.
1. ThrottleStop
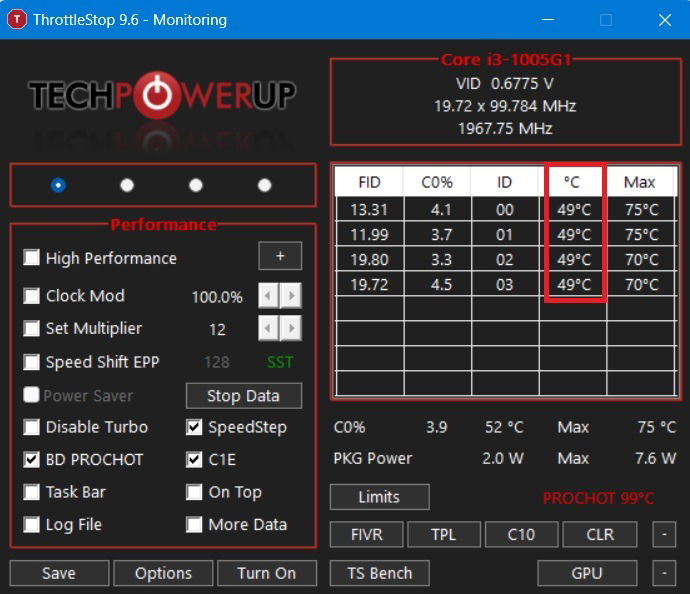
ThrottleStop is a popular undervolting tool that lets you undervolt your CPU to cool down temperatures immediately and prevent throttling. As an added bonus, it’s also a reliable means to measure your CPU temperature. You can take those readings from the home screen itself.
You can also get your CPU temperature to appear in the notification area on your PC. To do this, click Options at the bottom of ThrottleStop, then in the middle, check the CPU Temp box. Now, every time you open ThrottleStop, you’ll see a little number in your taskbar notification area showing your CPU temperature at that moment.
2. HWMonitor
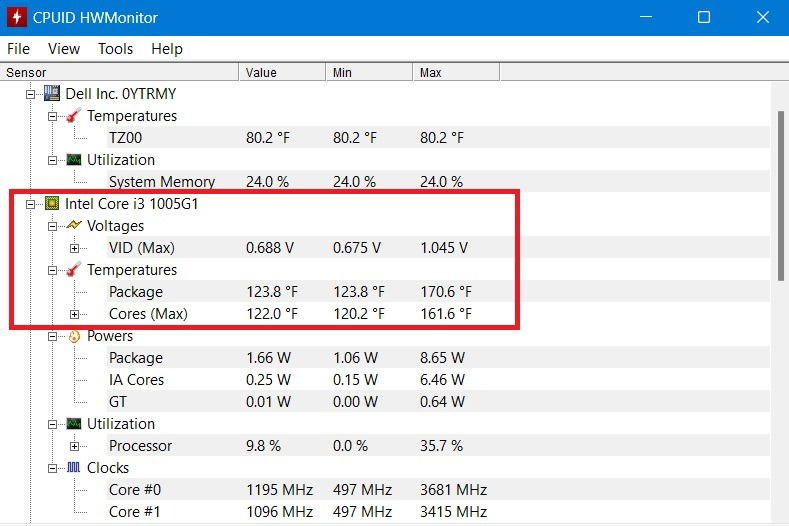
HWMonitor offers a fast and reliable way to check CPU temperature. The app does much more than just monitor CPU temperatures on one screen. At less than 3 MB size, the app is easy to run after installation.
In the main HWMonitor pane, scroll down to see your CPU listed with all its information. You’ll see the voltage of each core, the amount of CPU being utilized, and – most importantly – the temperature of each core. It displays the current temperature as well as the minimum and maximum temperatures.
Tip: do you frequently reach 100% CPU usage in Windows? It’s time to start dealing with this problem.
3. Core Temp
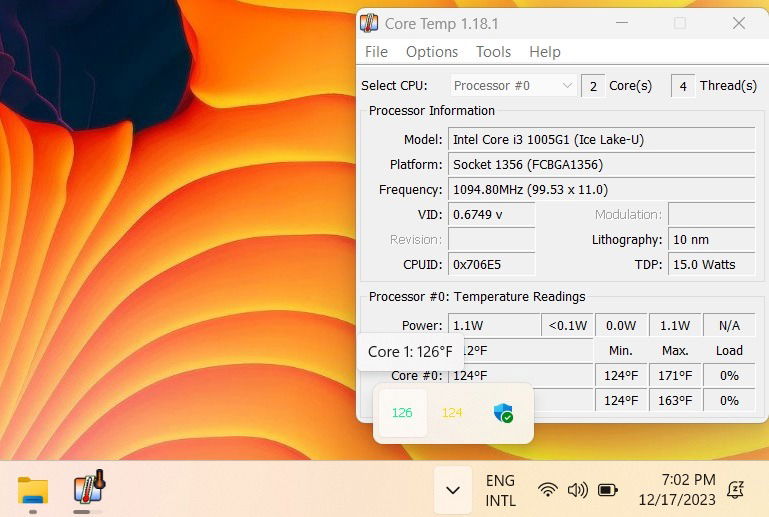
Core Temp is free, yet one of the most sophisticated tools that allows you to know everything about the processor’s temperature variables. After a simple installation (less than 3 MB), you can immediately start measuring the core temperatures.
The new version of the app has filters that allow you to adjust the temperature pulling and temperature logging intervals. After enabling the settings, you can minimize the app to the system tray. This will continuously monitor your PC temperature by reading all cores.
4. Speccy
Speccy by CCleaner is an extremely lightweight tool that quickly retrieves and checks your CPU temperature information. After download and installation, head to the CPU section column on the left. It will show all of the relevant temperatures for a healthy laptop.
If you’d like the temperature to appear in the tray, click View -> Options. Click System tray -> Minimize to tray -> Display metrics in tray, then select CPU. This is handy with the real-time CPU temperature graph generated on your screen to keep track of any sudden spikes during a long gameplay.

Also check: have you heard of Microsoft Compatible Telemetry? It can help you control the high CPU usage on your Windows computer.
5. HWinFO
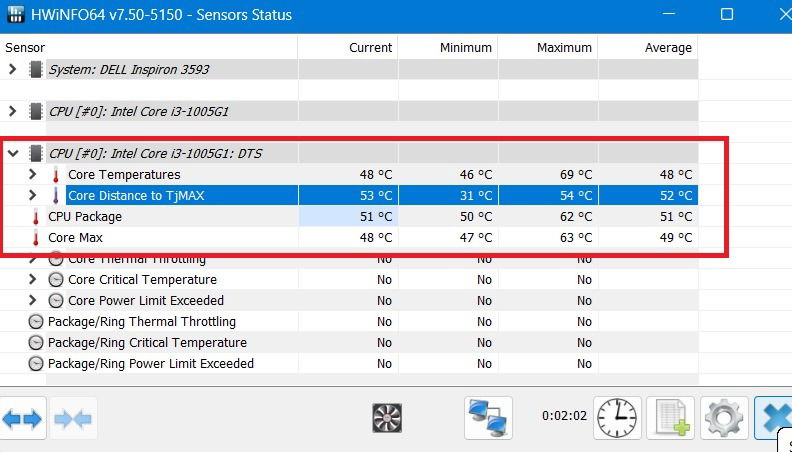
HWinFO is one of the most comprehensive, free Windows diagnostics software. The free download supports a complete range of Intel processors, from Xeon/Atom to Core i9, as well as most AMD processors, except the latest Ryzen family.
After launching the dashboard, navigate to the Sensor tab. Check the temperature values for the various CPU cores under the Sensor menu. With a right-click, you can add these temperature values to the system tray. If you want to monitor your CPU’s temperature rise over time, click Show Graph. You can keep track of unexpected spikes in CPU temperature.
Want to boost your PC’s performance? Consider getting an eGPU. They are also designed with games in mind, and for those who want to overclock their PC.
6. Open Hardware Monitor
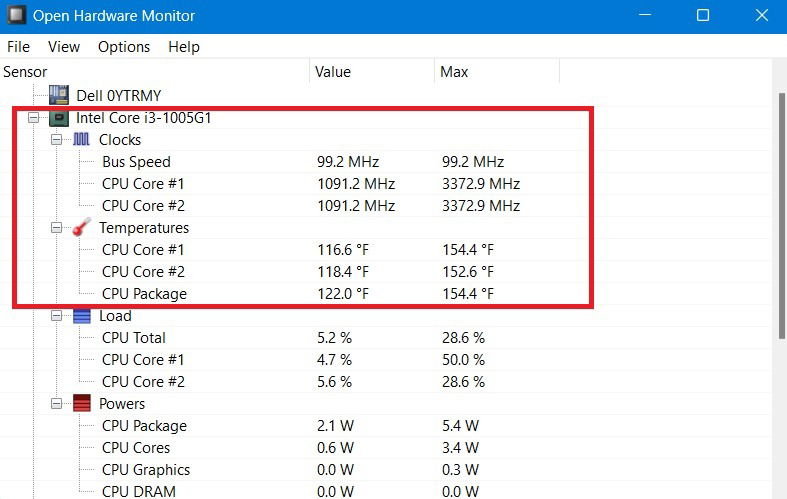
Open Hardware Monitor is a nice solution for getting all of your needed statistics in one place. You can find your CPU’s temperature under the category with your CPU’s name in it. It will list the temperature for each core your processor has.
If you’d like to see the CPU temperature in the taskbar, right-click the temperature itself, and click Show in Tray.
Tip: PC slower than usual? Learn how to fix “Windows Modules Installer Worker” high CPU usage with our handy tutorial.
7. Ryzen Master (AMD Ryzen CPUs only)
If your computer runs on a Ryzen CPU, you can use an AMD proprietary tool called Ryzen Master to measure your CPU temperature. It’s by far the most accurate way to track your CPU temperature for the Ryzen chipsets, as it has access to readings that other CPU monitoring tools don’t.
You can download Ryzen Master online from the official AMD page. To use it, open the app to see the temperature. It can be compared with the maximum temperature limits supported by your processor. (See the last section.)
Did your CPU temperature check out OK? You can squeeze out more performance by overclocking and undervolting your AMD Ryzen CPU.
Monitoring Your CPU Temperature When Gaming
While playing a game, users don’t like interruptions on a taskbar or other windows. To measure CPU core temperatures, they prefer a tool that does the job quietly in the background.
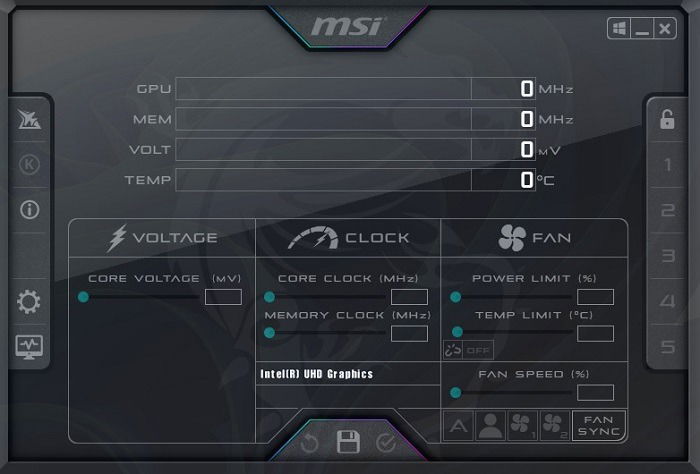
MSI Afterburner is one of the best tools for PC temperature measurement, keeping gamers in mind. It comes with RivaTuner Statistics server, both of which will install together. The temperature field is visible during gameplay. If your graphics card supports higher temperature limits, you can change the values so that you can enjoy your graphics-intensive game without disruptions.
AIDA64 Extreme is another all-inclusive diagnostics software with a special focus on CPU temperature values. It can work seamlessly with games being played on a computer. It supports both Intel Core 13000 and AMD Ryzen 7000 series processors.
Also read: find out the best CPU usage optimization tools for use.
What’s an Ideal CPU Temperature?
The average Intel or AMD processor for Windows devices can safely operate at under 60°C (140°F). Up until 70°C (158°F), it’s still safe, though a tad warmer. At 80°C (176°F), you can look at overclocking.
Here’s a quick way to find out the ideal CPU temperature for your Windows device. First, grab a quick summary of your CPU data by looking for Device Specifications under Settings -> System -> About. Take note of your processor name and details, including the GHz frequency.
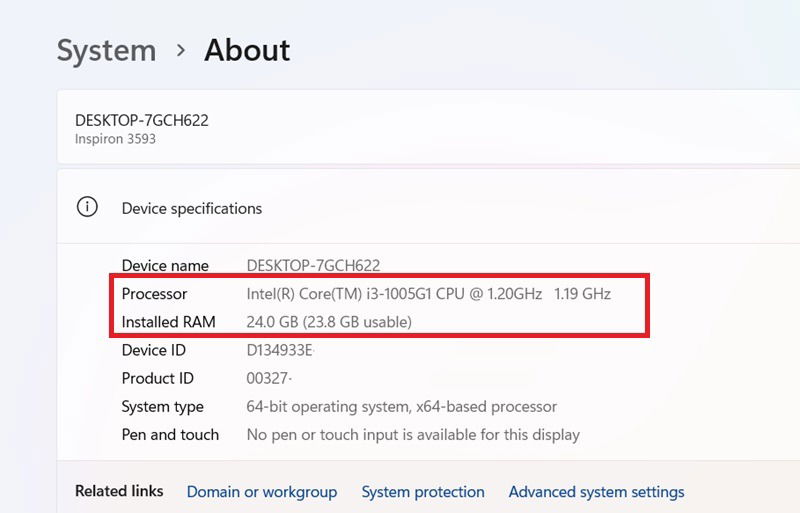
If you want to know what your processor’s max temperature is, search online for the product page of your specific CPU, then find where it lists its max ideal temperature. If the temperature is listed under something similar to “Maximum Operating Temperature” or T Case, then that’s the temperature that you should strive to keep your processor under most of the time.
If it says T Junction, the general advice is to keep things at least 30°C (86°F) under this stated temperature. So, if your T Junction value stands at 100°C (212°F), you really shouldn’t let your CPU temperature cross over beyond 70°C (176°F)
In the case of an older computer, you may also want to learn how to cool down a high CPU temperature to prevent an overheating issue. Need to learn more about laptop maintenance? Read our guide on how to fix Wmpnetwk.exe high CPU and memory usage in Windows.
Image credit: Unsplash. All screenshots by Sayak Boral.

Sayak Boral –
Staff Writer
Sayak Boral is a technology writer with over eleven years of experience working in different industries including semiconductors, IoT, enterprise IT, telecommunications OSS/BSS, and network security. He has been writing for MakeTechEasier on a wide range of technical topics including Windows, Android, Internet, Hardware Guides, Browsers, Software Tools, and Product Reviews.
Subscribe to our newsletter!
Our latest tutorials delivered straight to your inbox
Sign up for all newsletters.
By signing up, you agree to our Privacy Policy and European users agree to the data transfer policy. We will not share your data and you can unsubscribe at any time. Subscribe